Flowchart Maker Options: Complex processes or algorithms can be described more simply by creating a flowchart. Diagrams have always been an excellent tool for understanding and managing complex tasks. Moreover, the flowchart provides a variety of benefits. It helps ensure the smooth operation of all processes by plainly presenting the ideal picture of any work, inspecting, and establishing quality and efficiency standards. It also helps in communicating the entire process to the team. Additionally, it aids in identifying unnecessary steps and bottlenecks that help improve the work. Is it not extremely helpful? Yes, indeed! Therefore, let’s delve further into flowcharts and examine how to create one.
What’s A Flowchart?
A flowchart is a diagram that depicts the steps of any process or algorithm from top to bottom or right to left. It illustrates the entirety of the work in tiny tasks and concludes with a solution or the end of the process. It can be drawn on paper or digitally with the help of any software. It’s like a virtual map for your journey through a process that makes the path simple to understand. By making their bases, many authors have categorized flowcharts. For example, Sterneckert has categorized the charts according to “Flow Control.” According to him, there are four types of flowcharts. They do.
- Publish Flowcharts.
- System Flowcharts.
- Flowcharts for Data.
- Programming Flowcharts.
Similarly, there are numerous types in the flowcharts based on other criteria.
So, How Does It Help To Understand Things Easily?
Refining the workflow or algorithm helps a flowchart comprehend complex processes in one go. Any intricate process is perfectly illustrated by it. And help track what has been completed, what is next, and what is coming to an end. One can readily analyze the situation and act accordingly to achieve the desired and guaranteed results. And finally, it provides a predetermined conclusion at the end of a scenario.
It displays the entire process using various shapes for the steps. Since the steps in a chart may involve action, decision-making, documentation, input/output, wait or delay, etc. Therefore, all types of steps correspond to a specific shape. These are not the hard-and-fast rules, but rather some global standards to make them accessible to all.
For example, if a phase requires decision making, you must use a rhombus shape. And this is how different shapes are used for different types of steps. To show the order of steps, the arrows work as a path. There are a variety of attractive shapes for the steps, including rectangles, rhombus, elliptical, etc.
Prominent Shapes & Their Use In The Flowchart
Eventually, the various shapes were devised to designate the types of steps. In addition, there are a variety of shapes for various flowcharts and their steps. The following are some prominent and frequently employed shapes.
Terminator
For starting and ending points, it is oval-shaped. It is also used to describe the consequence of a path in a chart.
Decision
It gives two boxes for “Yes” and “No” responses to the decision. It can be comprehended by “if-else” statements used to compare and generate binary outputs in computer algorithms.
Process
A rectangle-shaped symbol is frequently used to represent a particular process, action, or function. Each of these boxes may have a single stage or multiple steps may be grouped.
Document
This shape is inserted when any document is requested for input. For example, receiving letters, emails, and orders. This symbol is used when a document is accessible for the output of data or an order. Creating a memo, a letter, etc., is an example of a document that can be output.
Data (Input/Output)
In the diagram, the rhomboid shape represents data accessible for input or output in the process.
Pre-defined Process
It represents a well-known process or one that has been defined elsewhere. In addition, it can be used for complex processes. Including these in the flowchart is optional, but they can be used to understand the inner workings of any process.
Manual Input
As its name implies, it refers to a person’s tangible input of data. A gadget or tool is typically used for data input.
Delay
This symbol represents the delayed work in a particular phase of the process. You may also include the delayed time in the D box to illustrate clearly.
Comment Or Annotation
When any phase necessitates additional information, the comment symbol is used. This symbol is enclosed in brackets with the necessary text. It may also include a dashed line connected to a section of the flowchart that requires clarification.
Database
It is cylindrical and is used when data is stored in a storage service.
On-page Connector
To prevent perplexing and congested meshes, an On-page connector is a small circle that connects various elements on the same page.
Off-page Connector
It helps connect the various elements on distinct pages. For some complex processes, creating flowcharts that span multiple pages may be necessary. In this case, these off-page connectors make things simpler.
Flowchart Use-Cases
In addition to computer science, computer algorithms are used extensively in business, manufacturing, education, engineering, sales, and marketing. In these fields, they encompass every conceivable aspect of a process. And give a complete backup from commencement to end. So, before creating your own, let’s examine some common applications of flowcharts.
Efficient Computer Algorithms
To develop efficient computer algorithms, flowcharts are the most helpful tool. Since they help understand complex issues, they can incorporate the entire concept into algorithms to create an effective logical solution. It, therefore, helps in communicating, discussing, and analyzing algorithms.
Planning New Projects
Many members of a team frequently work on novel initiatives. Therefore, flowcharts are very helpful when planning them. In addition, they help effectively depict the steps required to finish the entire project.
Auditing The Processes
Flowcharts are effective enough to identify process issues and provide a clear picture of the work. When the entire work is divided into small, sequential steps, it helps identify unnecessary elements and allows for enhancement. This saves time and guarantees an efficient workflow.
Managing Workflow
Workflow diagrams (a form of flowchart) are used for workflow management. The direction of human work, the integration of processes, or both may be the focus of workflow management. The processes are set up to produce the most effective and efficient output at the end.
Modeling Business Processes
Flowcharts facilitate the documentation of business processes. However, with numerous possibilities or results, these processes can be very typical in the end. Flowcharts can therefore make things certain and give them the right direction. An “event-driven process chain” (EPC) diagram is used for business processes.
Decision Making
To make the decision-making process quick, data-driven, and simple, Flowcharts can show all of the potential options. Flowcharts give your decision making thoughts a direction. In the end, it will help you make decisions more quickly. Now, let’s examine the intelligent flowchart maker options.
Top Flowchart Maker To Try
As we curated, the best Flowchart Maker options are listed below.
1. Canva

Canva’s great reputation is well-known, so there was no way I could exclude it from this list. In addition to the numerous possibilities of this Flowchart Maker tool, you can easily modify the colors, typefaces, and alignment of your flowcharts using professionally designed templates. It is designed with non-designers in mind, so everything is drag-and-drop. You can use up to 20 distinct graphs and add various symbols, images, and other elements. Then, with just a few clicks, you can save, download, or embed the flowchart into your presentations once you’re finished creating it.
2. Miro Flowchart
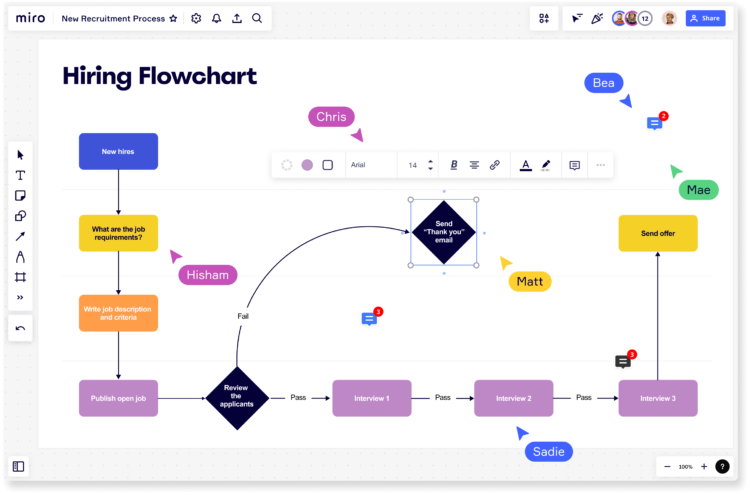
Miro excels at making flowcharts. You can design flowcharts and distribute them to team members, solicit their input, modify them, add them to presentations, or integrate them directly into Confluence, Microsoft Teams, etc. Additionally, with the help of Jira and Asana, you can add action items and create them into tickets from the same location. Its comprehensive feature set and user-friendly layout make it the ideal platform for all industries and sectors. As a result, Miro is used by over 35 million individuals from companies such as Dell, Deloitte, Okta, Cisco, etc.
It is optimal for those unfamiliar with creating flowcharts due to its flexible architecture and extensive feature set. The platform’s intuitive interface enables real-time collaboration in various settings, including meetings and seminars, agile workflows, strategy and planning, sticky notes, flowcharts, and diagrams, among others. Users can make mind maps, wireframes, and other diagrams and collaborate on them. In addition, its drag-and-drop interface makes it easy to add and connect components.
Its extensive template library makes designing flowcharts with a professional appearance simpler and quicker. In addition, Miro is designed with global security standards such as SOC2, SOC3, CSA, and many others in mind. As a result, every aspect of how teams communicate, generate ideas, and store their work is secure. Free to use, Miro has few features. To use its full-featured platform, you must convert to one of its three premium versions—starter, business, or enterprise.
3. Diagrams
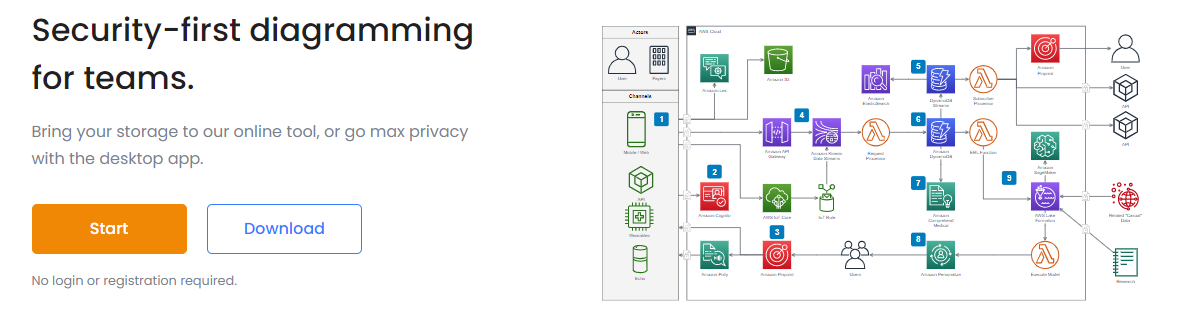
Diagrams, as its name implies, let you make a flowchart and various diagrams for various purposes. There are far too many elements to add to your project, categorized as fundamental, advanced, miscellaneous, etc. Within the canvas, you can make various adjustments to ensure that you’re creating something that reflects your style and is not constrained by the software. It also takes one click to align all your arrows and elements.
4. Lucidchart
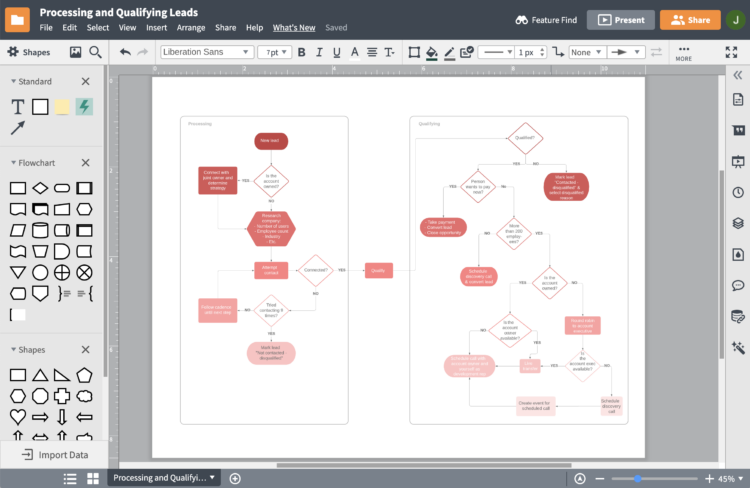
Lucidchart is a drag-and-drop flowchart creator with an extensive library of shapes and elements. Choose a template to make things happen quickly, or start with a blank canvas. Each added shape can be connected sequentially and modified in terms of color, text, etc. Once you’ve finished creating, you can save and share your flowchart in multiple formats and collaborate with your team members at any point. In addition, you can integrate Lucidchart with Google Workspace and Microsoft Office apps to increase productivity and accomplish more with the same amount of work.
5. Edraw
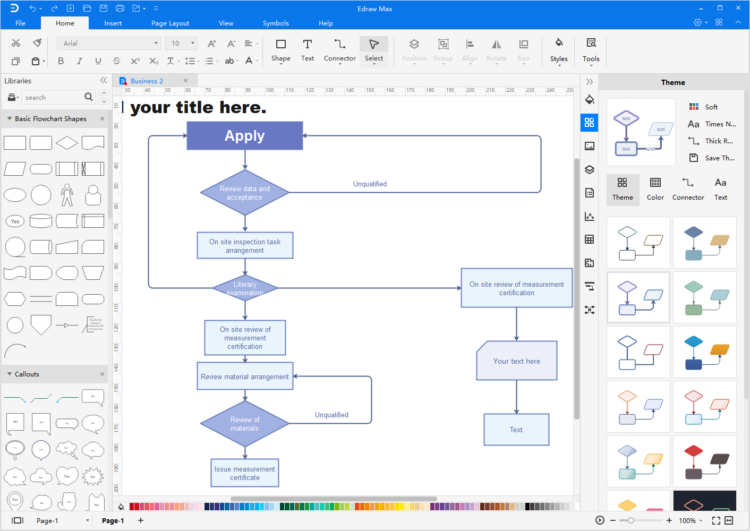
Edraw Flowchart Maker, compatible with Windows, Mac, and Linux, is comparable to the other programs mentioned in this article. Some of the world’s largest companies, including Samsung, IBM, and Intel, rely on it. It includes a variety of symbols, shapes, and elements that can be integrated using its drag-and-drop interface. It is also extremely simple to use. Even if this is your first time using a tool like this, you will have no trouble puzzling things out. The greatest aspect of Edraw Flowchart Maker is the lifetime access pricing, which will save you tons of money in the long run.
6. Creately
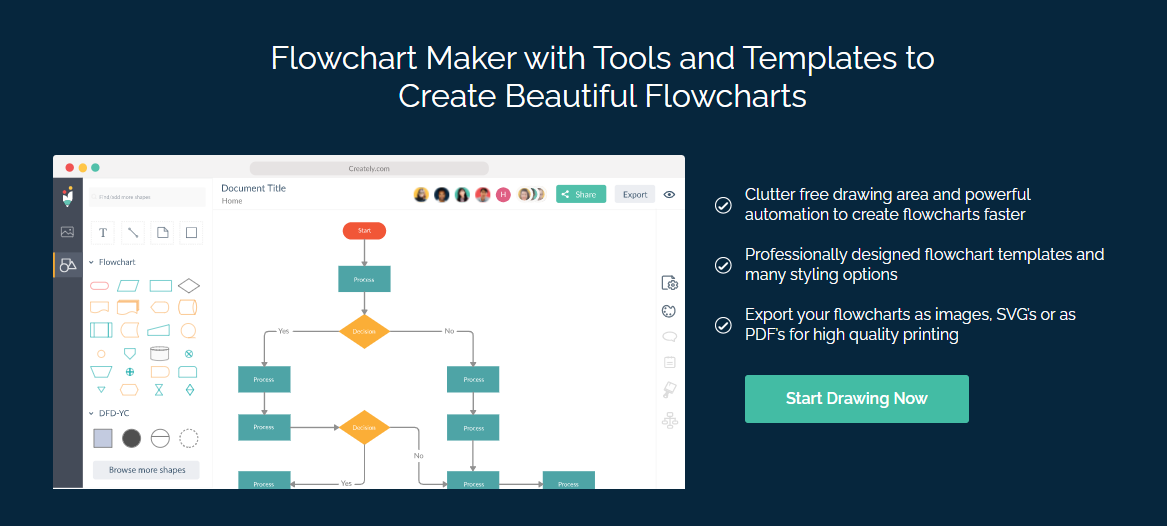
Creately, a very useful tool to help you create flowcharts with the help of templates, has automation that will make the process go much more quickly. To help your content stand out, it has tons of various shapes, diagram types, toolbar shortcuts, themes, and styles. In addition, the drawing area is spotless and clutter-free, allowing you to concentrate solely on creating your flowchart without being distracted every 5 seconds. This is one of the numerous reasons companies such as PayPal, Amazon, and eBay have used their service for so long. You can get started with the free plan, which has limited functionality. The paid plans, which start at $4.95 per month, give you a greater allowance to get a true sense of the tool’s capabilities.
7. Zen Flowchart
This list is dominated by Zen Flowchart, which is entirely free and trusted by over 650,000+ users worldwide, including Google and Spotify, primarily due to its ease of use. It only takes a few clicks to create a flowchart. Add new nodes or connect existing nodes using the help of intelligent connectors to get started. The interface is extremely simple and uncluttered, allowing you to concentrate solely on creating your content. In addition, you can effortlessly alter the nodes’ color and design with a single click. After creating a flowchart, you can save it as a PNG or dynamic document that automatically updates to reflect your most recent modifications.
8. SmartDraw
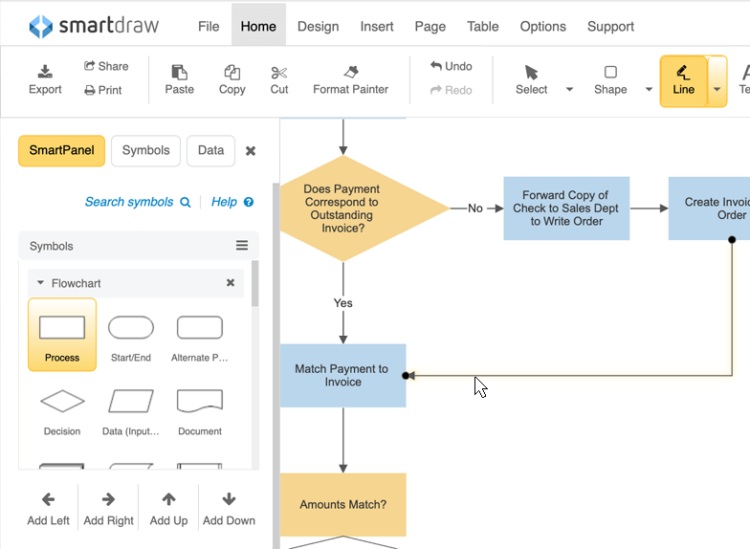
You can create your flowchart using SmartDraw online or download the software to your Windows computer. The choice between these two options is a matter of personal preference, as the ease of use will be identical regardless of which you choose. You can start by selecting one of the numerous pre-made templates and then adding steps with a few clicks. Additionally, you need not stress about formatting, as the tool handles that automatically. You only need to add a few basic commands, and it will rearrange the elements to make them appear great. All your created flowcharts can be stored in a shared folder, allowing your team to collaborate whenever necessary. Email or call their outstanding support team for help if you get trapped or have questions.
Also, Check:
The Bottom Line: Flowchart Maker
So far, we’ve discussed flowchart maker options and their applications.